BIALL Conference 2015 – a newcomer’s view

As part of my ongoing efforts to make the transition from History Teacher to Law Librarian, I have become a member of the British and Irish Association of Law Librarians (BIALL). I’ve found their journal, Legal Information Management, particularly helpful in gaining an understanding of many of the key issues confronting the profession. When I saw the opportunity to apply for a student bursary to attend their annual conference I jumped at the chance, and was very fortunate to receive the award. So, business cards printed, bags packed, it was off to Brighton for the 46th Annual Conference, which this year was themed around the title ‘Charting the Cs: Collaboration, Co-operation, Connectivity’.

I was a little apprehensive, since I’d only ever previously met two or three attendees in person, at the BIALL/SLA Europe/CLSIG Graduate day and the ILG/SLA Europe Information Literacy events, but they were a friendly and welcoming bunch of people, and I gained a great deal through my conversations with professionals from a wide range of backgrounds.

One of the themes which emerged repeatedly was the importance of law librarians (or whichever moniker they’re working under), getting out and about within their organisations. Professor Stephen Mayson, in the opening lecture, spoke of how there needs to be a shift from ‘back room procurer of materials to front of house expert’, and argued that there should be a shift of terminology from Knowledge Management to Knowing Management, in which there should be a focus on the connections to those who can contextualise information. Jane Bradbury , echoed this view in her presentation on ‘The continuing evolution of Knowledge Management in the Legal Profession’, when she explained how legal information professional must ‘carve out a role as custodians of a firm’s information and knowledge’. She too, argued for a redefinition of Knowledge Management to one more focused on ‘connecting people and enabling conversation’. Emily Allbon too, in her talk, ‘Infiltrate and conquer? Showing the world what librarians can do’, urged legal information professionals to get out and collaborate, and to get out of the ‘echo chamber’ in which you only talk within your own group. This point was further reinforced by Kathryn Hay and Esther Wheeler in their presentation ‘Information gatherer to knowledge connector’, where they explained how information professionals need to be more proactive and ‘can add best value by connecting the dots’.

The first day ended with a First Night Reception held at Brighton Museum and Art Gallery. This was a great opportunity to socialise, and I met a great group of people. The fun continued long into the night!

I enjoyed the second day even more than the first, feeling much more relaxed having got to know lots of people. It began with a really informative talk by Emily Goodhand, ‘The monkey and the camera: a copyright snapshot’, in which she clearly, and engagingly, explained the changes introduced in 2014. The talk which will stay longest in the memory though was by Sara Roberts, from the University of Canterbury in Christchurch, New Zealand, in which she movingly described the experience of trying to keep the law library service going following the devastating earthquakes which hit the city in 2011.

Another theme of the conference was that of how to best deliver legal research training, for both students, and trainees. Given that this is the topic of my dissertation, my notepad was ready, and pen poised! Stephen Mayson raised the concern that law firms are still unhappy with trainees’ skills, and made the point that students aren’t being trained to sift out the relevant from the irrelevant in terms of what a client needs. Kathryn Hay and Esther Wheeler argued that trainee induction would be better carried out by the library, rather than a separate training team, because librarians are closer to the knowledge. Angela Donaldson and Graham Ferris, in their talk, ‘Collaborating and co-operating to make the connection’, spoke about ‘situated learning’ and how physicality, networks and groups play an important part. In particular, they spoke passionately in defence of the law library as an important social space, and argued that finding case law in hard copy form, makes it easier to recognise its provenance, because you can see demonstrably, how a case fits in with broader law, in a way which is not so apparent with digital materials.

Two further sessions, ‘Law v learning styles’ and ”Techno teach’ gave further insights. In the former, Chris Walker and Karen Crouch explained how we need to instill the attributes of discipline, rigour and precision into law students, but that teaching methods need to be adapted to deal with the ‘net generation’. Jackie Hanes and Lisa Anderson, in the final session of the day, gave a really good presentation on the technologies which can be used to assist with legal research training; Jing looks to be an excellent piece of software for screencasting, and could be used to record a video showing how to search an enquiry.

The second day ended with the President’s Reception, BIALL Annual Awards and Annual Dinner. I had great company during the meal, and even found out that one of my old teaching colleagues is a very good friend  of the people sitting either side of me! Then what better way to end off my conference experience than with a disco and more socialising.

I found the whole conference informative, educative and very, very enjoyable. It has further strengthened my desire to become a law librarian. Many thanks to the BIALL Awards Committee for generously granting me a bursary to attend and to all those involved in putting on such a wonderful event!

Posted in Law Librarianship | Tagged , , , , , , , , , , , , , , , , , | Leave a comment

The Importance of Information Governance

I wasn’t planning on writing another post until the new year, but recent events compel me to do so. One of the modules I was studying this term was Information Management and Policy. It got me thinking about the processes and strategies which underpin good information governance; some of these are legal, such as Data Protection and Freedom of Information, whereas others are organisation-led and are concerned with how an organisation manages its information.

One of the areas which has been at the forefront of Information Governance has been the NHS. This isn’t surprising, as it is perhaps one of the most information-rich/heavy organisations in world and the sensitive nature of the information it holds necessitates good management.

Last Sunday my daughter was due to go to our local hospital to have minor surgery. My wife and I had been waiting many months for the operation to be scheduled, and although we were both a little anxious, we were relieved that our daughter’s issues would soon be resolved. When we received the letter confirming the operation date, another page was inserted with the names, dates of birth and details of operations of other patients scheduled for the same day. To give out such information, albeit accidentally, is pretty outrageous, yet when my wife phoned up the hospital to inform them of the error, the person’s response was basically, ‘well that was nothing to do with me’.

Two days before the operation my wife was rung to be told that our daughter’s operation would have to be cancelled as her notes had been lost. Apparently they had been sent to a different hospital within the same NHS trust. The notes were recovered, but we then had to wait a further four days for the operation to be rescheduled. Concerningly, when I mentioned on Twitter that the notes had been mislaid, the response I got was ‘typical’, ‘sounds par for the course’. It’s not a scientific sample, but it does raise issues of how commonplace these sorts of incidents are.

The most important thing is that my daughter is now on the mend, but the whole experience has shaken my faith a little. The security of patients’ records needs to be absolute. Protocols governing records need to be explicit and followed. I never expected that what I’d studied would so directly impact upon me and my family. It’s confirmed for me that Information Science is a necessary discipline in our modern world, and that Information Governance and Management are issues that need to be understood more broadly throughout society.


Posted in Information Management | Tagged , , , | Leave a comment

A time for reflection

In a couple of weeks times the TV schedules will become filled with programmes looking back at 2014 (in my opinion you can’t beat Charlie Brooker’s Wipe for how this sort of show should be done), and as my first term as a student at City University draws to a close, I’ve been asked to review my ‘digital output’ from an Information Science perspective. All blogs, are egotistical to a greater or larger degree, but this post is particularly navel gazing, nevertheless I hope to bring some analysis to bear rather than just pat myself on the back.

Prior to starting my Information Science course, I must confess I was rather ‘digital wary’. I had never signed up to Facebook or any social media account, barely contributed to any online discussion forums and was one of the few people I knew who did not own a smartphone. My whole attitude to the Internet was to regard it as just a new form of traditional media, in which I was merely a passive receiver of information.

Now of course, things have changed and I’ve been dragged into the 21st Century. I feel I have quite a strong presence on Twitter and these blog posts (although they’ve been a requirement of my course), have been enjoyable to write. I am finally beginning to make a ‘digital footprint’.

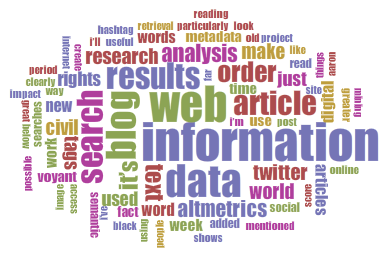
For our final Digital Information Technologies and Architectures (DITA) lab session, we were asked to analyse our Tweets and blog posts. I created a text corpus of all my blog posts and pasted it into Voyant for text analysis, the results of which can be seen in the two images below.

blog words

blogs voyant cloud

As with when I’ve used voyant previously, the exclusion of stop words allows greater clarity of results. I don’t think there are any great surprises revealed here, and the vocabulary is what would be expected of an Information Science student.

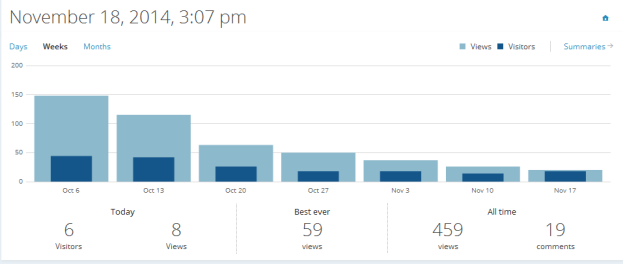
The stats page of my blog provides a lot of data. Excluding this one, I’ve published 11 posts, of almost 8,000 words, organised under 12 categories, and with 68 tags attached. My readership fell steadily after an initial wave of enthusiasm from my classmates, but the last 3 weeks have seen me consolidate a core of around 30 readers.

blog stats graph

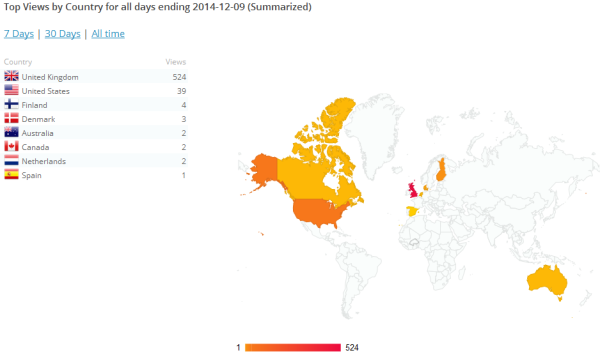
Surprisingly, I’ve also begun to attract a small number of international readers. That’s one of the (obvious) things about the World Wide Web, you may put something online which you may consider very local or parochial, but somewhere, someone else may find it of interest to them too.

blog views geographical

I then used an Excel template and Twitter Analytics to access a set of metrics for my tweets and activity on Twitter. I repeated the same process as I had done with my blog posts, and exported the text corpus to voyant. As you can see from the first image below, I’ve been very active on Twitter, but nevertheless, I was still surprised to find out just how many words I’d actually written – an even greater number than in my blogs. Obviously, it’s going to vary from person to person, but I’m sure that this situation, (where more words are written in a micro-blogging format than in actual blogs) is most probably the norm rather than an exception.

twitter

tweets words

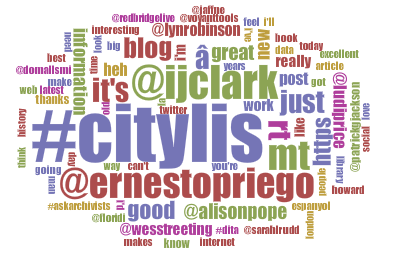
The word cloud produced by voyant also reveals that on Twitter I focus more on social relationships rather than concepts. My most used words are, the hashtag for my course, the usernames of the people that I chat with most often and RT and MT. All of these are signifiers of communication rather than an indicator of what’s being discussed. This highlights for me one of the key differences between blogging an micro-blogging. In a post such as this I can develop my ideas and try my best to explain them to the reader; whereas on Twitter it’s about sharing resources with people and building relationships and networks.

tweets voyant cloud

Twitter analytics allows users to see metrics for the impact of their tweets. It shows the impression made, which is the number of times the tweet was seen; its level of engagement, which is the number of times someone clicked on it, replied to it, favourited it, or retweeted it; and this produces an engagement rate, which is the number of engagements divided by the number of impressions.

By these criteria, my most ‘successful’ tweets were:

With 4,024 Impressions

successful tweet1

With 28 Engagements

successful tweet2

With an 18% Engagement Rate

successful tweet3

By looking at this we can discern 3 features which make a successful tweet:

1. Engagement with a wide group of people using a popular hashtag

2. Links to events or activities which may interest other people

3. Short, vague, ambiguous statements with a hint of the dramatic, plus a hyperlink

Despite this, I’m not going to try to reshape my tweets just to become ‘popular’, because I believe that it’s best just to be natural on social media; however, I can see how an organisation or business could possibly derive great value from understanding how to promote their message more effectively.

If anyone would like to get in touch with me on Twitter, I’m @SteveMishkin, you can often find me hanging out at #citylis. Drop by, say hello!

I’d just like to end by thanking all of you who’ve ever taken the time to stop by and have a read. I’ll be continuing the blog in the new year, but will probably no longer be posting weekly, more likely monthly, or whenever I feel like there’s something I’d like to share with you. I wish you all seasons greetings, see you in 2015!

Posted in Text Analysis | Tagged , , , , | 2 Comments

No fate but what we make – Creating a Semantic Web

skynetMany Sci Fi fans will recognise that this week’s title and the image above both come from Terminator 2, a film in which in a dystopian future, an Artificial Intelligence defence system called Skynet has waged war against humanity. The film’s great fun, but it does touch on concerns which some people do have about AI. After watching it last week I posted a jokey tweet about how this could be linked with a worry about the development of a Semantic Web.

https://twitter.com/SteveMishkin/status/538845864807374849

https://twitter.com/SteveMishkin/status/538846097301848064

I was a little surprised therefore, when just a few days later an image of the Terminator was used to accompany an article about Stephen Hawking, in which he too (less jokily) raised concerns about the development of AI.

Obviously, Artificial Intelligence and the Semantic Web are two different things, (AI is essentially the creation of a computer which can ‘think’, whereas the Semantic Web is more concerned with allowing a computer to ‘know’), but what they both have in common is the desire to make computers more responsive.

This was our theme for our lecture and lab work this week, the Semantic Web. As mentioned earlier, the idea behind the Semantic Web is to advance to a situation where data is not only machine-readable but machine-understandable. This has been the ambition of Tim Berners-Lee and his World Wide Web Consortium (W3C) for many years now, but the goal is still some way off. The solution lies in the ways in which data is encoded on the web. For a Semantic Web to exist, a far greater depth of metadata needs to be added to data and documents. This would make the process of Information Retrieval far more efficient, because a search engine would no longer have to make good ‘guesses’, because everything would be unambiguously tagged. Consequently, information processing and discovery could become automated.

To try to facilitate this, W3c have helped develop a Resource Description Framework (RDF), which aims to give a grammar for how things are described on the web. Taxonomies can be created to identify things, and ontologies to create logical rules for inferences which can be made about them. This helps create a Semantic Web stack, the building blocks of a Semantic Web; the RDF adds metadata to web resources; an RDF Schema is used to create a taxonomy for it; and Web Ontology Language (OWL) creates an ontology to add a greater sense of meaning. The W3C wants everyone who wishes to add this depth of metadata to their resources, to use the same language. Only if a uniform way of doing things is agreed and applied, can a Semantic Web stand a chance of coming about.

This is a massive simplification of what is a very complex topic. The reality is, that only a small proportion of web developers are even considering it as an issue. In the lab we looked at how www.artistsbooksonline.org uses the Text Encoding Initiative (TEI) to mark-up its text. The site is a web repository for art works which adds a great depth of metadata in order to improve the experience for the user.

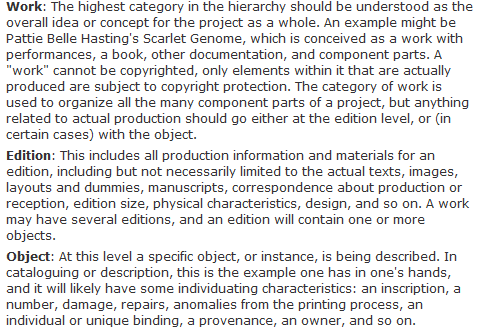
Each work has related metadata provided under 3 hierarchical headings: Work>Edition(s)>Object(s)

The site describes the headings as follows:

4artists books online 3 level structure

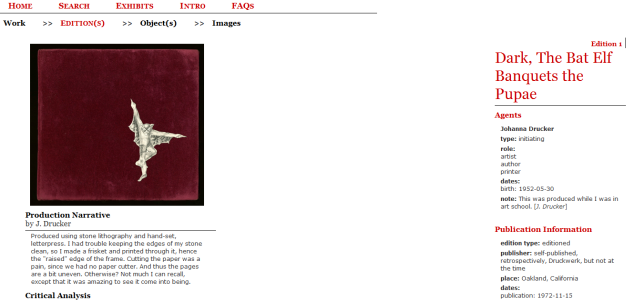
The site uses  RDF triples to try to bring a greater sense of meaning to the data it presents, as in the following example:

Subject                                                        Predicate                                Object

Johanna Drucker                                          Wrote                  Dark, the bat elf banquets the pupae

Dark, the bat elf banquets the pupae    Was published                     In 1972

Below, you can see how the site displays the work alongside its metadata.

dark

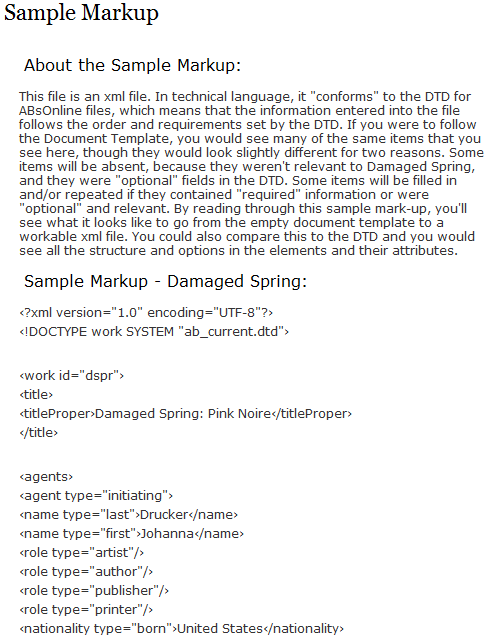
The TEI mark-up which the site uses, requires a Document Type Definition (DTD) which defines the elements and attributes of each page of XML.

markup

This XML metadata isn’t available to view for the individual works on the site, rather, we just view it as human-readable data. Nevertheless, the fact that this mark up has been added, means that the site is very navigable and has a high level of functionality, something which it shares with the Old Bailey Online site I discussed in my previous post. These two sites do give some indication of what’s possible to achieve when one attempts to attach a high degree of metadata to a resource. It’s clear that an awful lot of work has gone into making this possible and here lies the problem. For a Semantic Web to exist, there needs to be a universality of this level of coding, but for a range of reasons, primarily, time and lack of knowledge, we’re unlikely to see it’s widespread adoption in the near future.

However, we must remember, that we are still witnessing the infancy of the World Wide Web, and in the future no one knows for certain how things will develop. But one thing we do know: There is no fate but what we make.

Cue closing credits.

Not everyone’s cup of tea, but in keeping with this week’s theme, I present to you Metal Heads – Terminator, Goldie’s 1992 classic, acknowledged by many as the first ever drum and bass track.

Posted in Semantic Web | Tagged , , , , , , , , , , , , | 2 Comments

Heigh-Ho, off data mining we go.

Being the father of a 3 year old, we watch a fair amount of animation in our house. You hear of social critics bewailing the pernicious effect of tv and cartoons on children, yet it’s really the parents we should all be worrying about. As soon as I heard the phrase ‘data mining’, the first thing which entered my mind was, “we dig, dig, dig, dig, dig, dig, dig, in a mine the whole day through”. Unlike the dwarfs however, it’s not diamonds we’re after, but gems of information and meaning in big data.

In the pre-digital age, text analysis was a long manual process and there were human limits as to how many texts could be read and compared. Nowadays however, there exists a vast digital corpora and the technology to search, read and analyse it. This automated process is usually referred to as Data Mining.Data Mining presents tremendous opportunities to the researcher, and in our lecture this week, Ulrich Tiedau, Associate Director of the Centre for Digital Humanities at UCL, illustrated this to our class by showing its application to the Digital Humanities. He explained how he and his colleagues were examining Asymetrical Encounters between Reference Cultures and those of the Low Countries (Belgium, Netherlands and Luxembourg). It’s a study of six countries over two centuries, and relies on analysing long runs of data contained within digitised newspaper collections. A new text mining tool called Texcavator has been developed in order to search through the Dutch Digital Library, Europeana (a collection of digitised European newspapers) and other collections.

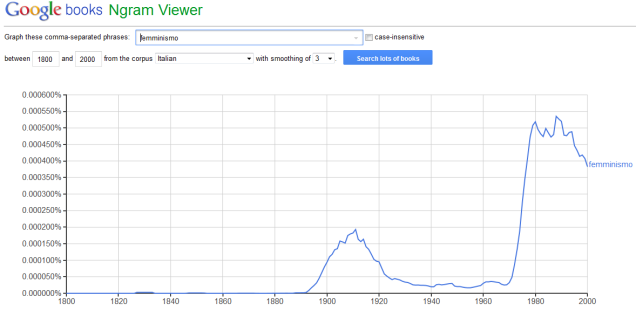
Ulrich went on to explain two other examples. Firstly, the way in which Google’s Ngram Viewer (by visualising the frequency of a word in a corpora of books over time), can stimulate research questions; e.g from the graph below, what can account for the rises and falls of ‘feminism’ in Italy during the Twentieth Century?

italian feminism

Finally, he explained how Topic Modelling can be used, in which an algorithm conducts a statistical analysis of the corpora in order to group together sets of words which tend to appear together. This is quite an interesting take on text analysis / data mining, because rather than feeding in keywords, instead, you can just see what patterns are thrown up.

In the lab I began to put these ideas into practice by: exporting data from the Old Bailey online API to voyant; and, by examining the Aysmetrical Encounters research project of the Utrecht University Digital Humanities Lab.

With Altmetrics I’d been looking at the issue of the Civil Rights Movement in the USA, so it made me curious as to whether there had been any convictions at the Old Bailey for offences involving race riots. I firstly, searched the Old Bailey Online database with the key word ‘race’ and filtering for the offence of ‘Breaking Peace > riot’. There were only two results and in both cases the word race was from a different context to my query. I repeated the search for keywords ‘African’, ‘Negro’, ‘Jew’, ‘Alien’, ‘Foreign’ and ‘German’ but received no results. This doesn’t prove that there were no race riots in the period 1674-1913, only that there were no convictions. Obviously, these searches weren’t great for data mining, since I had no data!

I then decided to examine those crimes which had resulted in the death penalty, since I knew there would be plenty of data, and I was correct. I searched over the whole period, 1674-1913 and carried out separate filtered searches by the crimes they were convicted of. The results were as follows: Breaking Peace (198); Damage to Property (35); Deception (442); Killing (442); Miscellaneous (295 – of which 259 were for Returning from Transportation); Royal Offences (568); Sexual Offences (142); Theft (6357); Violent Theft (2340). As I suspected, the range of reasons for which people were sentenced to death in the past was pretty vast and was overwhelmingly for non-violent crimes.

I then went to the site’s API Demonstrator, which allows the user to export results to voyant for text analysis, or to the bibliographic management system Zotero. The API was structured slightly differently to the original search, with the two key differences being: that using the API you are able to search by the gender of the offenders and victims; whereas in the original search you are unable to do so, but you can search for names of offenders and victims. I’m not really sure why both features aren’t available in both formats, since they are potentially very useful.

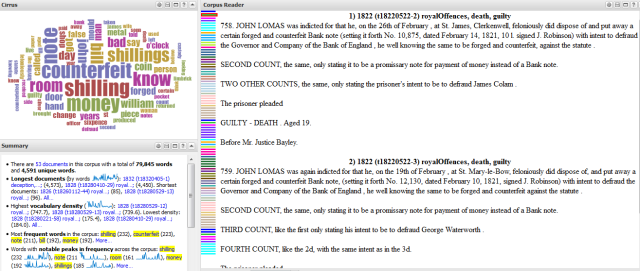
Using the API I decided to narrow my investigation by focusing on Royal Offences, and sent two sets of search results to voyant. Royal Offences resulting in the death penalty between 1674-1694, and secondly, between 1822-1842 (the last year in which a person was executed for a Royal Offence). I wanted to examine two samples, in two periods, but over a similar period of time, in order to see the extent of similarity or difference between them. The results were exported to Voyant for further analysis.

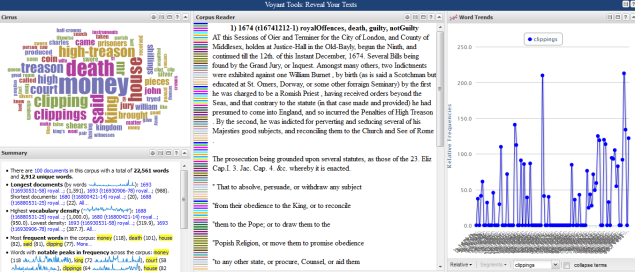
A good feature of the link between the API and Voyant is the fact that stop words are automatically applied, however, it makes sense to add custom words such as ‘prisoner’ ‘court’ ‘indictment’ etc which relate just to the trials rather than the cases themselves. The image below show the reults of the1674-1694 search exported to Voyant (the search yielded 103 hits, of which the first 100 were exported). The resulting word cloud shows that there were two main types of offence within this category, and they were high-treason, and the clipping of coinage. A search on the frequency of the word clipping shows a pattern of peaks and troughs. This information could be used for further research if it was overlaid with statistics on inflation or other economic data in order to build up a greater understanding of the economic circumstances at the time.

older

The image below show the results of the exported search on the period 1822-1842. Over this period the search yielded 52 results, (of which all 52 were exported to Voyant) half the number from the earlier period. The word cloud shows a significant difference from the one above, most noticeably, the fact that there were no incidences of ‘high treason’, and that crimes to do with money had changed in nature from ‘clipping’ to ‘counterfeiting’.

later2

As I think I’ve shown, even a very cursory use of these tools can deliver very revealing results for a researcher, and with greater experience, skill and focus, a user will find them very useful indeed. I’d just like to give a big thank you to Professor Tim Hitchcock (@TimHitchcock), director of the Old Bailey Online project, and Dr Sharon Howard (@sharon_howard), project manager, who both helped me out when I had a few technical difficulties. For those of you who are interested, Sharon Howard has a blog, ‘Crime in the Community‘ which examines the Old Bailey Online, and the London Lives projects in greater depth.

Finally. I spent some time examining the website of the Asymetrical Encounters research project. It’s still very much an ongoing project and at present is very much describing its work in the future tense rather than as a set of results, as you can see from this screen grab below.

future

The project includes links to Conferences and the article ‘Big Data for Global History’ outlining the process of undertaking such an ambitious task. Clearly, it’s in the scope of the project where this diverges most radically from the Old Bailey Project. Being transnational in character, research into Asymetrical Encounters faces far more challenges, such as gaining full access to the digitized newspaper collections of all the countries in the study; nevertheless, I look forward to reading about their findings in the future.

Data mining opens up a world of possibilities for research, yet there are still obstacles in place, as outlined by Michelle Brook, Peter Murray-Rust and Charles Oppenheim in their 2014 article, ‘The Social, Political and Legal Aspects of Text and Data Mining (TDM)‘. Chiefly, these are to do with users and the law. Firstly, there is a lack of awareness among many academics of the opportunities TDM presents and many lack the technological skills and confidence to use the available resources. Secondly, although there have been recent changes to UK copyright law, there are still issues regarding the mining of data from other jurisdictions and many issues have still not yet been tested / established in the courts, and this can lead to some reluctance on the part of publishers and academics.


Posted in Data Mining | Tagged , , , , , , , , , , , , , | 2 Comments

Screwing around

As you can see from the picture below, interest in this blog continues to fall – some may even go so far as to describe it as moribund!

site stats

In a desperate attempt to reverse the slide I’ve resorted to the cheap MailOnline tactic of the clickbait headline for my latest post.

Of course, as students @ #citylis well know, the title is really just wordplay on the title of a recent article by Stephen Ramsay, a keen advocate of the digital humanities and the use of text technologies. In ‘The Hermeneutics of Screwing Around; or What You Do with a Million Books‘, he describes “the anxiety of not knowing the path” through the enormity of the world’s literature and the consequent “debates about canonicity” which have been endemic in his field of Literary Theory since its inception. Ramsay refers to literary scholar, Franco Moretti, who in his latest book, ‘Distant Reading‘, calls for the use of computers as one possible path through this vast digital corpora. Ramsay then goes on to make the case for “serendipitous browsing”, which he describes as “screwing around” and “one of the most venerable techniques in the life of the mind”. He bemoans the fact that if a full text archive (of the type which Google Books hopes to create), does not also include the “vast hypertextual network that surrounds it”, then the result will be text analysis tools which are good for searching but “simply terrible at browsing”. In his opinion, this will result in “a landscape in which the wheel ruts of your roaming intellect are increasingly deepened by habit, training, and preconception. Seek and you shall find. Unfortunately, you probably will not find much else.”

I found this to be a very thought provoking article, particularly the way in which he challenged a lot of my preconceived ideas about information retrieval and the cataloguing of information. Personally, I do still enjoy browsing books on shelves, not knowing what I’m going to find. Catalogues are great for finding what you know you want (or an approximation of it), but I still enjoy the serendipty of finding something new.

We returned to the ideas of Moretti at the end of last week’s lecture. Essentially, he is arguing that since we now have access to vast digital databases of literary work, and effective data retrieval systems, it is now possible to combine the two in order to amass quantitative evidence in the field of literary studies. This is an entirely different approach to the close reading which has for so long been held up as the key technique of the discipline. A point I raised at the time, was that I hoped the baby wouldn’t be thrown out with the bathwater. Clearly, close reading / hermeneutics is still an effective method in and of itself, and I do hope that a ‘cult of the new’ wont lead to its abandonment. Rather, what digital text analysis offers is a new way of examining literature and, in combination with traditional methods, promises an even better way of advancing human understanding.

Which leads me to the final section of this post, in which I’d like to share some of my thoughts about some of the text analysis tools which are available today: Wordle; Many Eyes; and Voyant.

All three operate by analysing inputted text. To carry out these evaluations I chose to copy and paste the text results of my TAGS analysis of the Twitter hashtag #libchat, and my Altmetrics search on Civil Rights (discussion of TAGS and Altmetrics can be found in my previous posts, ‘TAGS: a reappraisal‘ and ‘Hello, can you hear me?‘).

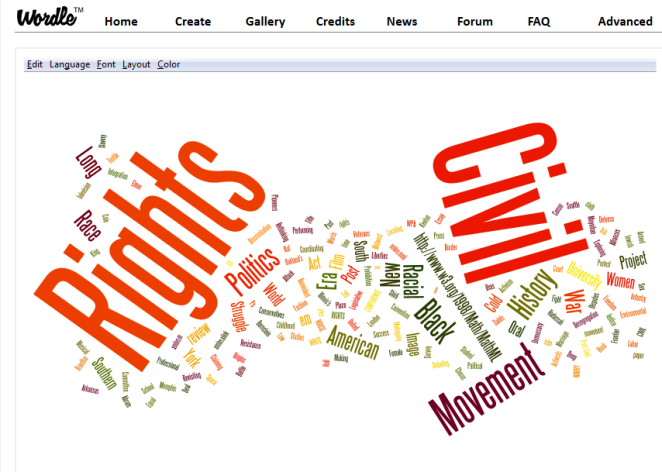
First up is Wordle, a much maligned, but very simple to use application which generates word clouds from inputted text. Julie Meloni, in her 2009 article, ‘Wordles, or the gateway drug to textual analysis‘ praises it for its ability to help introduce a topic, help students discover key words and topics they may not have otherwise noticed, and help students to reflect on their own writing and word choices.

I pasted in the list of Civil Rights articles which I’d found previously using Altmetrics. The word cloud you can see below, was partially useful, in that it showed two main things; firstly, that the overwhelming focus of articles is on the Movement itself; and secondly, that there was also a fairly broad hinterland in terms of other themes addressed, such as race, women and war.

Civil Rights wordle

Wordle is not without its detractors though. Jacob Harris, in his 2011 article, ‘Word clouds considered harmful‘ even goes so far as describing them as “the mullets of the internet”. His main criticism is that because they’re so easy to create, they are often used as filler visualisations which either support only the crudest sort of textual analysis, or are applied to complex situations where textual analysis isn’t appropriate.

In my view, there is benefit, but like with all things, it does require a bit of thought in order for it to be used to best effect.

Next up is Many Eyes, a package which promised much, but didn’t always deliver. As with Wordle, I began by importing my data set.

many-eyes data set

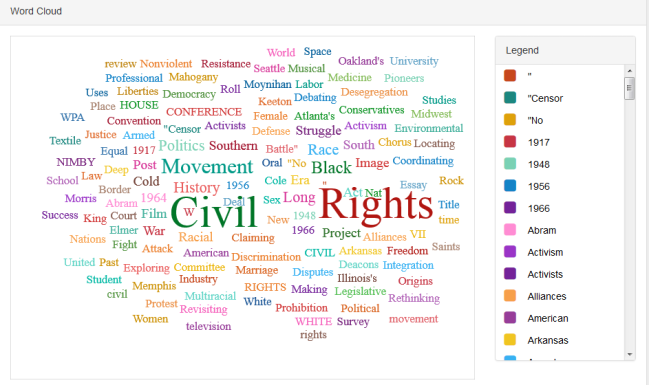
I then used Many Eyes to produce a word cloud, which I believe gives greater clarity than Wordle.

many-eyes word cloud

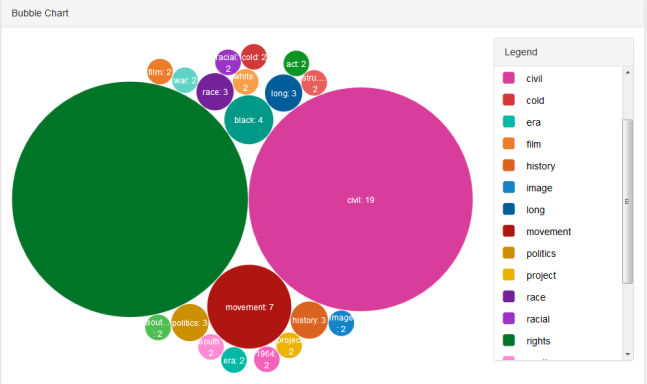
I also produced a bubble chart, which was helpful in showing the frequency of words used in the titles of Civil Rights articles harvested by Altmetrics.

many-eyes civil rights bubble

Many Eyes has a good range of visualisations on offer, the problem however, is that I found it quite slow, buggy at times and not intuitively as straight forward as the final tool I used, Voyant.

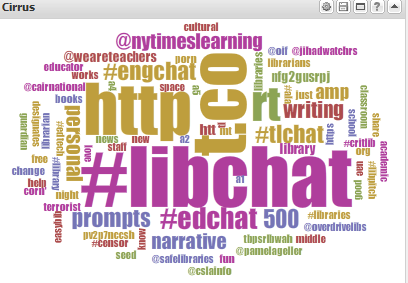
This was by far my favourite of the three, offering good usability and a fine range of options. As with the above, I experimented using data sets from both TAGS and altmetrics. A particularly useful feature of Voyant is the fact the you can exclude stop words including custom words of your choice. This can allow you to really focus in on what the text shows. Take the following two images for example. In the first, a word cloud was produced for the TAGS Twitter analysis of the #libchat hashtag, using stop words. We can see that it is dominated by the name of the hashtag, http, and twitter codes (rt and t.co), which doesn’t really tell us anything at all about the content of the tweets.

voyant libchat tags cloud 2 with stop

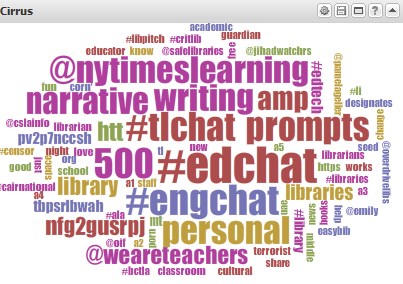
The second image shows the cloud with these aforementioned phrases excluded. Now we can focus more clearly on what is being tweeted; links to other hashtags, and discussions surrounding libraries, writing and learning for instance. This is much more useful information to a researcher.

voyant libchat tags cloud 2 with stop and mods

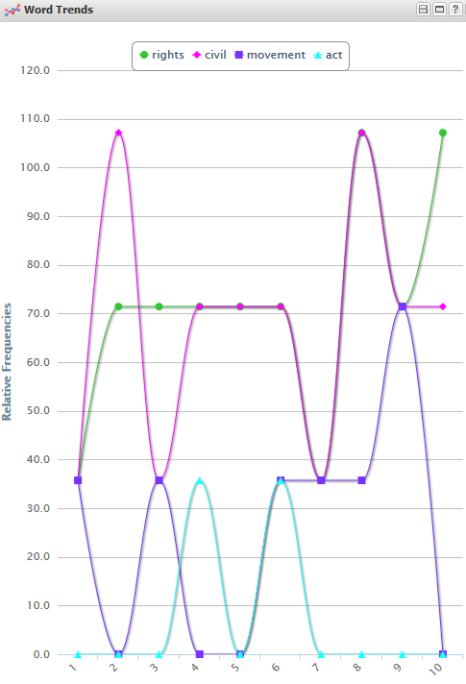
The final features I’ll describe are the fact that Voyant examines the frequency of words in the corpus (particularly useful when used with stop words), and also shows word trends in the form of a line graph. As you can see below, by searching for the trends of Civil, Rights, Movement and Act, we’re able to discern that articles on Civil Rights tend to focus more on the movement itself, rather than the 1964 Civil Rights Act.

voyant civil rights word trends

All in all, a useful tool and one I look forward to using more in the future with greater confidence and skill.


Posted in Text Analysis | Tagged , , , , , , , , , , , , , , , | Leave a comment

TAGS – a reappraisal

This week we’ve been exploring the world of Text Analysis, using tools such as Wordle, Voyant and Many Eyes. To do so, we needed text to examine, and for that purpose we reused the data sets created from our previous TAGS and Altmetrics exercises. I’ll be writing a post this weekend in which I’ll tell you how I got on and what I’ve found out, but today, it seems apposite to reevaluate the benefits and limitations of TAGS.

TAGS is an app developed by Martin Hawksey @mhawksey which mashes up the Google and Twitter APIs in order to collect tweets and their metadata, and display them on Google spreadsheets for analysis. It’s quite an ingenious solution to a serious issue confronting information professionals and other social scientists – how can we make sense of the masses of data created on Twitter? Or as Richard Rogers puts it in Twitter and Society (2014), “debanalising Twitter”.  The following quote from Rogers reinforces the pertinence of TAGS, “Twitter is particularly attractive for research, owing to the relative ease with which tweets are gathered and collections are made” (preface, p. xxi)

Hashtags are an important component of Twitter, facilitating the creation of communities and conversations. I particularly like the fact that this was a development which came from the user base of Twitter rather than the designers of the app, since for me, it’s a perfect illustration of the web’s democratic nature and  the potential therein to create previously unthought of positive outcomes. The TAGS app allows us to search the tweets under any hashtag, and thereby draw some conclusions about the communities the hashtags represent.

I made two searches, one for #citylis and the other for #libchat. I searched for #citylis because it’s the hashtag for my LIS course at City University and so I was curious to see the patterns of the hashtag’s usage. I searched for #libchat because it’s also a hashtag I follow on Twitter, particularly when they’re having a prearranged live discussion, similar to the one just announced by#uklibchat

The app was pretty straightforward to use although it does require a bit of patience at times; when my classmates and I were all using TAGS simultaneously it was noticeably slower than when I repeated a search today at home.

I wont share my findings of both searches because it will be repetitive, but will report back on my findings regarding  #libchat. If you would like to read an analysis of  #citylis then please refer to my blogroll which list the blogs of my classmates, although this post by Dominic deals with it very effectively.

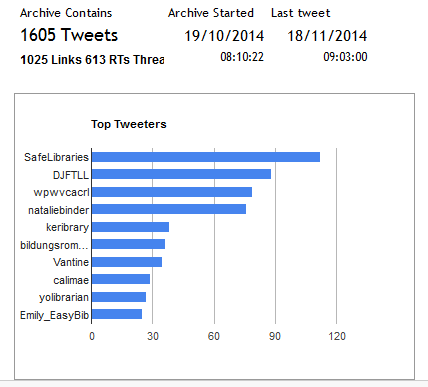
TAGS created an archive, displaying the number of tweets and top tweeters:

#libchat top tweeters

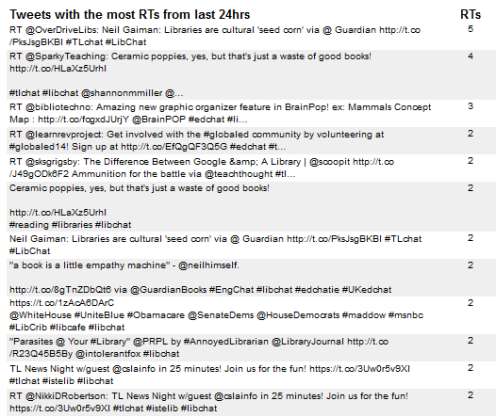
A list of the most retweeted tweets in the past 24 hours:

#libchat most retweeted

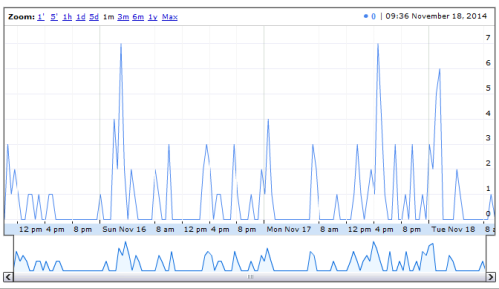
An hourly display of activity under the hashtag:

#libchat tweet activity graph

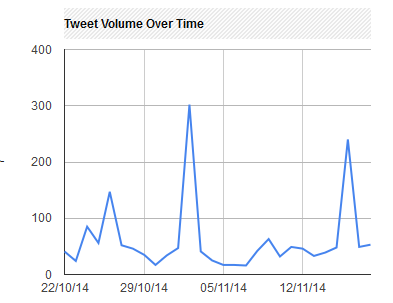
And a line graph displaying tweet volume over time.

#libchat tweets over time graph

The last graph clearly shows spikes of activity whenever a prearranged topic is occuring, but we can also see that the hashtag is used at other times as well.

To conclude, TAGS is an imperfect but very useful app which can be used in many different ways, and is ideally suited to making sense of the data which is generated on Twitter. I plan to use it much more in the future, and in my next post you will be able to read how I used the data derived from TAGS to conduct a text analysis.


Posted in Analysing Twitter | Tagged , , , , , | 1 Comment

Hello, can you hear me?

We live in a world of competing voices, each struggling for attention amongst the hubub. Now, more than ever, it’s easy to express oneself, yet this very reality, can also make it more difficult to be heard. Academics cannot escape this new paradigm either. In the past, they would contribute journal articles, write books and present papers to conferences; yet now they are increasingly expected to write blogs, tweet and have a more visible online presence; but are they being heard?

This week in our DITA class we were exploring the world of altmetrics. These are Alternative Metrics by which the impact of academic journal articles can be measured. Traditionally in academia, the measure of the ‘success’ of an article was by the number of citations which it received; this still remains a valid and important measure. Nevertheless, there has been a move in recent years towards identifying and measuring the broader societal impact of academic work. These twin complementary approaches can hopefully provide a clearer picture of the impact of an article has. I believe this to be a very positive step, because for academic research to be truly meaningful it needs to be disseminated and read as broadly as possible, rather than remaining largely irrelevant and only read by, and of interest, to fellow academics.

Advances in technology, particularly the development of social media and the APIs which permit us to engage with the data generated therein, makes the generation of these altmetrics possible. So how can we assess the societal impact of an article? In order to be traceable by altmetrics, a document needs to have a Digital Object Identifier (DOI), which is a unique string of numbers. These DOIs contain important machine-readable metadata. Rather than counting its citations in other articles, altmetrics counts the number of mentions an article has on social media, page views, mentions in blogs and mentions in news reports. A score is then produced for an article based upon the level of attention it has received and the quality of that attention. A low score would indicate that an article has made little impact, whereas a higher score would indicate a larger impact.

With a score of 8298, the highest rated article on altmetric.com is a scientific abstract examining an aspect of the ecological damage caused by the Fukushima nuclear disaster in 2011. The main determinant behind its very high score was the fact that a link to it was tweeted 16229 times by 10,015 tweeters. This fact in itself, resulted in the article then being referenced in two news reports, by the International Business Times and Chemistry Views. This shows us the entwined and cannibalistic nature of social media – success begets success; the two articles (which were commenting on the success of the article) then combined to push up the score of the article further!

Each altmetric score is represented graphically as a multicoloured ring, with each colour representing a separate source where the article was mentioned (e.g red for a news source, dark blue for Facebook, light blue for Twitter); therefore, the more multicoloured the ring, the more broadly across sources has the article been mentioned, and conversely, if a ring has just one colour then it means it has only been mentioned in one source.

altmetric-badges.a.ssl.fastly.netThis is the ring for the article with the highest altmetric score I mentioned previously.

Currently altmetrics is best set up to measure the societal impact of scientific articles, so I was curious as an historian to see how History articles fared under this system. I made two separate but related searches into an area I am interested in and have taught, the struggle for Civil Rights and racial equality in the United States in the 1950s and 60s. For both searches I kept the parameters exactly the same in order that a fair comparison could be made between the results. I first searched for articles with the key words “civil rights” from Journal Subject ‘History and Archaeology’, mentioned at any time, on any app. I then repeated the search with the key words “black power”. These two searches were then saved in My Workspaces.

Workspace title Email reports Export
All mentioned articles from journal subject HISTORY AND ARCHAEOLOGY with keywords “black power”, with at least one twitter,gplus,news,linkedin,blogs,pinterest,video,facebook,reddit,f1000,rh,peerreview,weibo,policy mention (delete?) To Excel
All mentioned articles from journal subject HISTORY AND ARCHAEOLOGY with keywords “civil rights”, with at least one twitter,gplus,news,linkedin,blogs,pinterest,video,facebook,reddit,f1000,rh,peerreview,weibo,policy mention (delete?) To Excel

I was curious to see where the current focus of scholarship lies in this field. Traditionally the overwhelming majority of research has focussed on the non-violent Civil Rights Movement, yet in 2006, with the publishing of The Black Power Movement there was a slight reorientation to an examination of the significance of Black Power upon the broader struggle for racial equality.

Both searches came up with very limited results, with ‘Civil Right’ still proving a more popular topic than ‘Black Power’. There were 18 results for Civil Rights, although 3 had to be dismissed for lack of relevance (focussing on Gay Civil Rights and the Environmental Civil Rights movements) and 5 results for black power. Results could be viewed in the interface either as standard or tiled (which both utilised the altmetrics ring graphic), or as condensed, which was my preferred view, showing the results clearly in tabular form. Additionally, results can be exported to Excel as CSV files, where filters can be applied to allow the user to get into the data better.

Only two of the articles from the Civil Rights search came into double figures (11 and 13), whilst the highest score for any Black Power article was only 2. This would appear to suggest that both these areas are neglected in scholarship at present and that that research which is being published has very little resonance in social media.

Altmetrics is a welcome tool, I do however, have some caveats. Firstly, the results it throws up are largely quantitative and tell us how widely the article has been mentioned. In itself, it doesn’t tell us whether the reception was positive or not. Theoretically, an article which has been very negatively received could nevertheless be given a very high altmetrics score, solely down to thousands of people on Twitter saying ‘check out this article, it really sucks!’. Likewise, altmetrics give us no indication as to the quality of an article.

Furthermore, I do have to question the accuracy of the search results. Today I carried out the exact same searches just 5 days after my initial searches. The Black Power results were identical but a further 7 Civil Rights articles were found. Clearly these articles have not been published in the last 5 days, so why did they not appear in the original search?

Clearly these are the very early days of altmetrics, and with time and further development, it will hopefully prove as useful to the social sciences as it currently does for the scientific community.

Posted in Altmetrics | Tagged , , , | 4 Comments

#citylis at the Movies: The Politics of Information

Yes, I have been reading, honest, but for my first post this week I’d like to share my thoughts on two very different films I saw last week: The Internet’s Own Boy and Brazil. Fear not though hardy reader, for this will not be a  sub-Kermodian 6th form Film Studies rant, but rather an attempt to examine what we can learn from these two films about the nature of information, particularly the question of the ownership and use of information.

As mentioned in my previous post, last week as part of our LIS course at City University, the 2014 documentary, ‘The Internet’s Own Boy: The Story of Aaron Swartz’ was shown. It tells the tale of the life and tragic untimely death of one of the pioneering programmers and social activists of the internet age.

A brilliant young man, Aaron Swartz helped develop RSS, and created the website Reddit, whilst still in his teens. Following the sale of Reddit, he briefly worked in the corporate world but swiftly became disillusioned with it. He dedicated much of the rest of his life to campaigning for internet freedoms and greater access to information,  promoting Creative Commons, launching the Progressive Change Campaign Committee and working to oppose the Stop Online Piracy Act.

Aaron believed that the internet could be a positive force for change, but equally, that it was necessary to struggle to realize this potentiality. He saw this dialectic between an open web and a proprietorial closed one, manifested clearly in the case of JSTOR. JSTOR is a digital repository containing a vast library of academic journals. The problem as Aaron saw it, was that they were charging high fees to access this content, content which he believed should be free. Much of the research contained therein had been paid for through publicly funded grants, and therefore, he felt that it was unreasonable to make people pay to access content they had already contributed towards. Furthermore, he saw how this situation would exacerbate an information divide between those who can afford to access research and those who cannot. On an idealistic level, he also believed that it is through the free sharing of academic research that further progress in human understanding  can be encouraged and consequently, connected a laptop to the network at MIT and began a bulk download of documents from JSTOR. His laptop was discovered and CCTV recorded Aaron swapping hard drives with the machine. What followed was a federal prosecution which later culminated in Aaron taking his own life.

The story was powerful, moving and tragic. He was no criminal, out to hack peoples’ credit cards or seeking to profit by selling the materials he downloaded. He simply believed that research should not be pay-walled but rather, should be freely accessible to whoever wishes to read it. Although Aaron Swartz is no longer with us, the campaign for Open Access continues, with Open Access Week events being held all over the world just last month. Judging by some of the messages I read on Twitter, I know I was not alone in being moved by this excellent film.

To continue with the theme of movies and LIS, for Halloween @ernestopriego tried to get a meme going on twitter.

https://twitter.com/SteveMishkin/status/528173632972136448

But for me, nothing best arouses the feeling of  horror, than Terry Gilliam’s 1985 masterpiece, Brazil.

I had the great pleasure of watching this at the BFI on Saturday, followed by a Q+A with its visionary director Terry Gilliam. It was showing as part of the BFI’s Sci Fi: Days of Fear and Wonder season, although Gilliam himself said, “I always thought of it as a documentary.”

The film is a bleak, surreal, Orwellian vision of life in a bureaucratic totalitarian state, in which the control of information plays a central role. The main protagonist, Sam Lowry, is a functionary working at the Ministry of Information, who accepts a promotion to Information Retrieval, solely to gain access to hitherto restricted information.

Though a work of fiction, I believe Brazil raises many of the same political issues that were apparent in The Internet’s Own Boy: who controls information in society? How and why is information controlled? How can people access information more freely?

Some of these issues are examined by Luciano Floridi, who is at the forefront of the new Philosophy of Information. This reading week I’m planning on reading his latest work, The Ethics of Information, (as reviewed here in David Bawden’s blog ‘The Occasional Informationist‘), in order to hopefully bring me a little closer to discovering some of the answers to the questions posed above.


Posted in Information Ethics | Tagged , , , , , , , | 3 Comments